
The socket you use changes the result
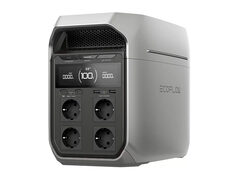
Start with the case you can check at home. An EcoFlow Delta 3 Plus is rated at 1,024 Wh. Through its mains socket it returns 860. Through its 12 V output, 895. Through a USB-C port, 937. Same battery, same charge, same day: a 77 Wh gap between the best and the worst output, which is a full phone charge.
The reason is mechanical. The mains socket runs through the inverter, which turns the cells' direct current into alternating current, and that conversion sheds heat. The USB-C and 12 V outputs skip that stage: they serve DC from DC, with only a voltage adaptation, which costs far less.
| Rated | Mains socket | 12 V output | USB-C | Gap | |
|---|---|---|---|---|---|
| EcoFlow Delta 3 Plus | 1,024 Wh | 860 Wh | 895 Wh | 937 Wh | 77 Wh |
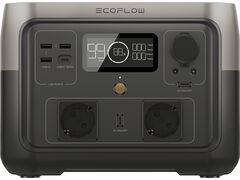
| EcoFlow River 2 Max | 512 Wh | 377 Wh | 443 Wh | 450 Wh | 73 Wh |
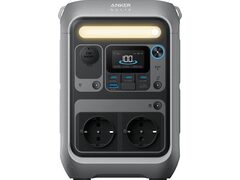
| Anker Solix C300 | 288 Wh | 240 Wh | 254 Wh | 266 Wh | 26 Wh |
The practical rule fits in one sentence: whenever a device will accept USB-C or 12 V, feed it that way rather than through the mains socket. That covers phones, tablets, most recent laptops, compressor cool boxes, lights and a good share of camping gear.
The harder you pull, the more you get back (up to a point)
Here is the counter-intuitive part. It is tempting to assume a gentle discharge spares the battery and draws more out of it. On a power station, the opposite happens across the normal operating range.
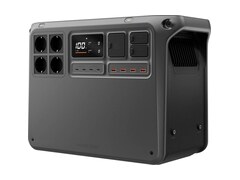
The DJI Power 2000, rated at 2,048 Wh, returns 1,573 when asked for only 100 W. At 500 W it gives back 1,725. Then, at 1,600 W, it drops to 1,579. The curve climbs, peaks, and falls away.
| Rated | Low load | Medium load | High load | |
|---|---|---|---|---|
| DJI Power 2000 | 2,048 Wh | 1,573 Wh (100 W) | 1,725 Wh (500 W) | 1,579 Wh (1,600 W) |
| EcoFlow Delta 2 | 1,024 Wh | 745 Wh (20 W) | 871 Wh (120 W) | 930 Wh (900 W) |
| EcoFlow Delta Pro 3 | 4,096 Wh | 3,911 Wh (500 W) | 3,999 Wh (2,000 W) | |
| EcoFlow River 2 Max | 512 Wh | 366 Wh (50 W) | 373 Wh (150 W) | 377 Wh (500 W) |
The explanation is a fixed cost. A station that is switched on consumes for itself: screen, fans, control electronics and, above all, the inverter. Germany's ADAC, which measured eight stations on a common protocol, notes that switching on the built-in inverter alone can cost some thirty watts. Those 30 W are close to a third of a 100 W draw, but only six per cent of a 500 W draw. The heavier the useful load, the more that toll is diluted.
Past that point the movement reverses: near its maximum output the inverter works in a less favourable zone, the fans spin up, and conversion losses take over again. Hence the bell.
Why an efficiency percentage on its own means nothing
If efficiency depends on the output and on the load drawn, then quoting "88 %" without saying under what conditions the figure was taken is like quoting a speed without saying on what road.
Standards bodies conceded the point long ago. The European standard EN 50530, which governs efficiency measurement for grid-connected photovoltaic inverters, does not produce a single number: it measures efficiency at six load levels (5, 10, 20, 30, 50 and 100 % of rated power) and then weights them. The 50 % level alone accounts for close to half the final result, because that is where these devices spend most of their working life. Fraunhofer ISE, whose power electronics laboratory is accredited for such measurements, publishes a procedure derived from that standard specifically for bidirectional inverters, which is exactly what sits inside a power station.
We owe our own figures the same honesty. The 46 restored-capacity measurements published in our reviews come from independent protocols that do not all use the same load level or the same output. They are therefore not rigorously comparable with one another. Where the discharge power is known, we write it into the review. Where it is not, we say so too, rather than implying a precision that does not exist.
What our 46 measurements show
Across the 32 power stations for which we hold a measurement, the energy actually returned spans 73.6 to 97.6 % of the rated capacity. Including power banks, the range drops to 64.5 %. Here are the two ends of the table.
| Rated | Returned | Share | |
|---|---|---|---|
| EcoFlow Delta Pro 3 | 4,096 Wh | 3,999 Wh | 97.6 % |
| Anker Solix C300X DC | 288 Wh | 272.9 Wh | 94.8 % |
| EcoFlow Delta 3 Max Plus | 2,048 Wh | 1,940 Wh | 94.7 % |
| Jackery Explorer 2000 v2 | 2,042 Wh | 1,920 Wh | 94.0 % |
| Jackery Explorer 500 v2 | 512 Wh | 479 Wh | 93.6 % |
| Bluetti Elite 200 V2 | 2,074 Wh | 1,910 Wh | 92.1 % |
| DJI Power 1000 | 1,024 Wh | 838 Wh | 81.8 % |
| EcoFlow River 3 Plus | 286 Wh | 231 Wh | 80.8 % |
| EcoFlow River 2 Max | 512 Wh | 377 Wh | 73.6 % |
And this is where everything above pays off. The station at the bottom of that table, the EcoFlow River 2 Max at 73.6 %, returns 450 Wh through its USB-C port, which is 88 % of its rated 512 Wh. The ranking does not say it is a poor machine. It says which socket we measured.
Two methodological notes to close the frame. The leader, the Delta Pro 3, owes part of its score to a high measurement load, 2,000 W, favourable for the reasons set out above: at 500 W it falls to 3,911 Wh. And the general order of magnitude holds up against independent laboratories: the ADAC finds net capacity averaging 10 to 15 % below the gross capacity manufacturers advertise.
Working out your real runtime
For sizing an installation or planning a weekend off-grid, the rated capacity is a poor starting point. Here is how to reach a usable figure in three seconds.
On the mains socket, multiply the rated capacity by 0.85. On the 12 V and USB-C outputs, by 0.92. Those two coefficients bracket the great majority of our measurements and leave a sensible margin.
To go faster, our runtime calculator applies these coefficients for you, and uses the actual measurement from our review where we have one.
A worked example. A 45 W compressor cool box on a station rated at 1,000 Wh: the gross figure would promise 22 hours. Through the mains socket, count on 850 Wh usable, a little under 19 hours. Feeding the cool box from its 12 V plug instead, count on 920 Wh, a little over 20 hours. The gap between the two connections is more than an hour and a half of cooling, for free.
Three habits to finish with: prefer DC whenever the device allows it, avoid leaving a small load on standby on a large station, and, when comparing two models, look in the review for the power at which the measurement was taken. An efficiency figure without its measurement conditions is not data, it is an impression.