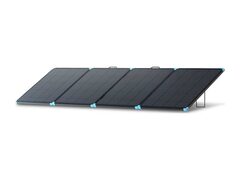
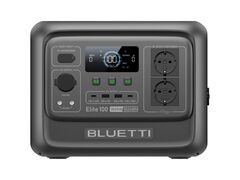
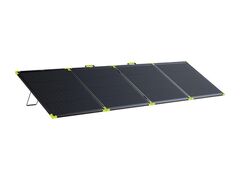
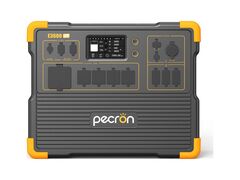
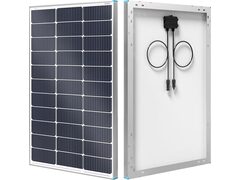
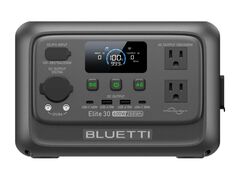
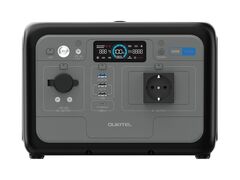
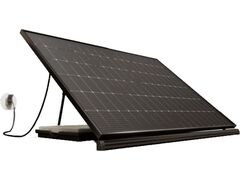
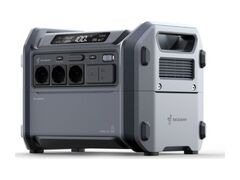
The real payback time of a solar panel and a power station, before you reach for your card.
💰 Your solar kit
How long before a panel and a station pay for themselves in electricity you no longer buy? Pick a panel and a station from our catalogue, or enter your own figures.
Your location
08 kWh/m²/day
Southern England3.0 kWh/m²/day
kWh/m²/day
£/kWh
Click a dot on the map to change location. The colour shows the average sunlight over the year. With a keyboard, the arrow keys move from one region to the next.
Total investment
£1,016.60
Estimated annual savings
£145.55
Payback time
7.0 years
Net balance over 10 years
£438.91
This station has no solar input at all: no panel can charge it, whatever model you pick.
Panels oversized for this station (power and/or current): only 727 W out of the 800 W installed will be used. The figures below already account for this.
Estimate: daily output = total power (Wp) × equivalent sun hours × 0.70 (the yield used for a nomadic panel, poorly angled and without solar tracking, outside the scope of an optimised fixed installation). Sun hours and the electricity price are market averages, to be adjusted to your region and supplier. Calculation horizon fixed at 10 years.
Sunlight: horizontal irradiation measured by PVGIS (European Commission, 2016-2020 average). Electricity price: readings taken on 28 August 2026 (suppliers and national regulators).
💡
With a single panel, only 10.8% of catalogue combinations pay back within 10 years. That climbs to 20.7% with 2 panels, 29.3% with 3, and 35.4% with 4: scaling up spreads the station's fixed price further.
Ready-made profitable pairs
A selection of well-rated panels and stations (4.0/5 or above), physically compatible (solar input respected) and profitable within 10 years.